what an uncertain market.
how, what is one to do if they have money out there?
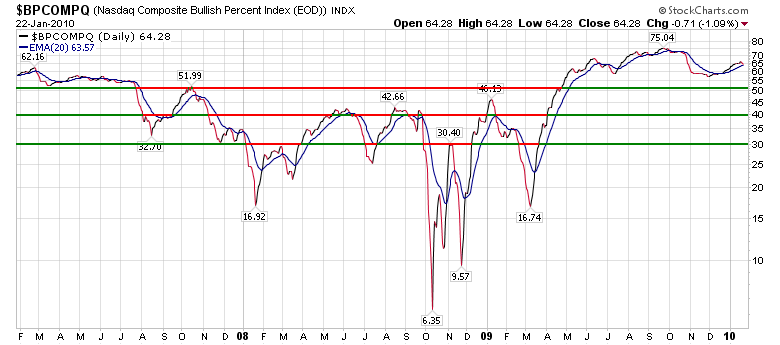
the above chart of the nasdaq % bullish shows that a majority of stocks still have point-n-figure charts( supply and demand charts) that appear bullish. in fact the number of bullish charts remain just above the 20 day moving average of such. so the short-term trend may be turning down, but that process could easily go the other way. so, rely on your trailing stops or if you are a very sophisticated trader buy puts for protection. or if you want to own your companies as a long-term investor just sit tight and hold on.
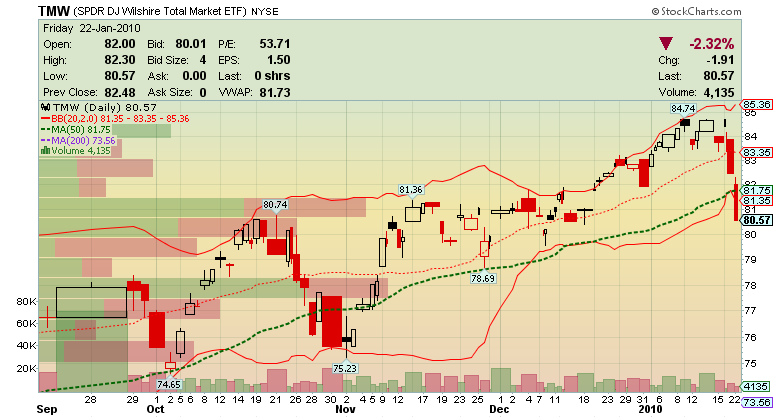
the total market, tmw, has support around 76 or 5% down from here. we've already given up 4% - 5%. so if you are long-term investor, buy some antacid and like i said hold on. who knows if we will turn around before reaching the previous level of support? i will leave my trailing stops where they are. if things go down i will stop out of everything. i'm leaning this way because my screens are finding many more potential shorts than potential longs. that suggest that we may be seeing things rolling over.
but, who knows?

